Infrastructure and Operations
For deployment, container orchestration, Linux administration, and production operations.
 Kubernetes (R&D / Lab)
 Docker
 Podman
 RHELUbuntu ServerBashGitHub Actions
 Nginx
Nginx Prometheus
 GrafanaNagiosBlackbox Exporter
Tooling used across platform operations, backend delivery, observability, and deployment workflows.
For deployment, container orchestration, Linux administration, and production operations.
Kubernetes (R&D / Lab)DockerPodmanRHELUbuntu ServerBashGitHub ActionsNginxPrometheusGrafanaNagiosBlackbox ExporterFor business logic, APIs, and system integration workloads.
 Java
Java Spring Boot
 PythonFastAPI
 Erlang/OTPGo
 C++
C++ PostgreSQLMariaDB
 MongoDB
 RedisClickHouse
For SMS Firewall implementation, incident response, and carrier-grade messaging platforms.
For learning and experimenting with language-model architecture, training, evaluation, and local inference.
For dashboards, portals, and user-facing interfaces around platform systems.
 React
React Next.jsReact Native
 TypeScript
 JavaScript
 HTML
HTML CSS
CSSPublic backend platform: microservicefrontend.rumalg.me
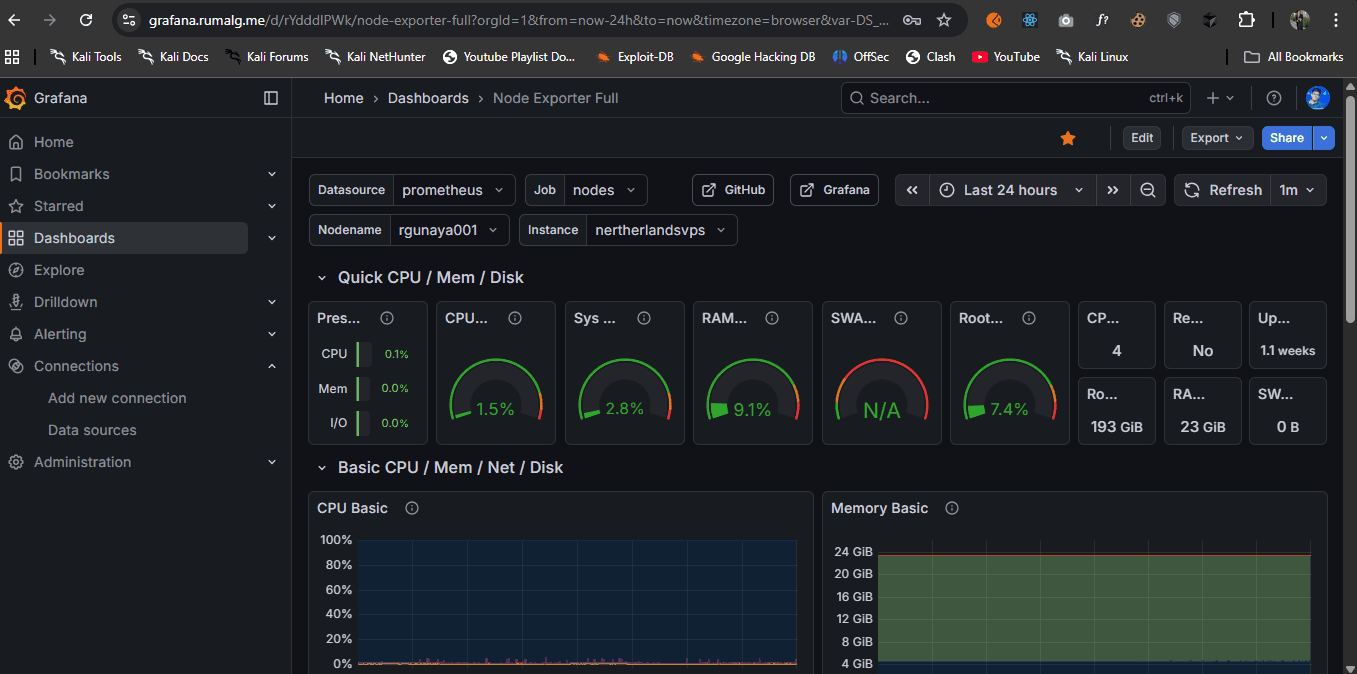
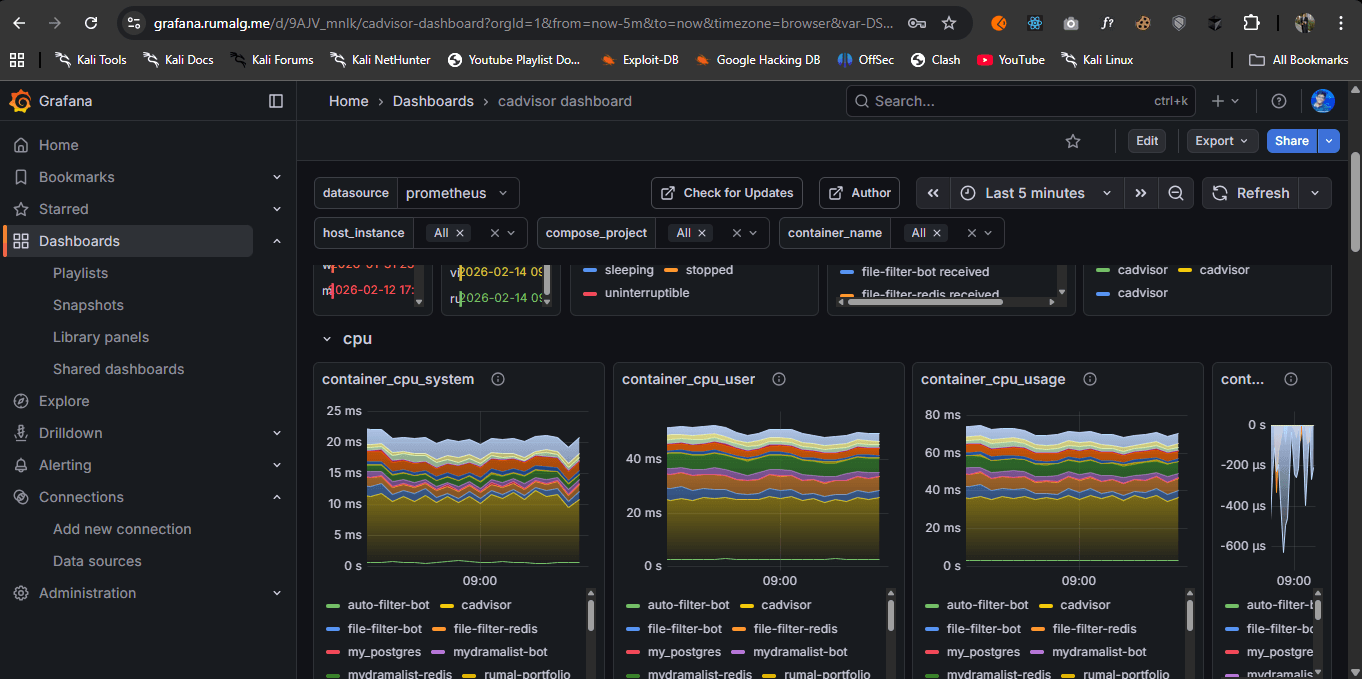
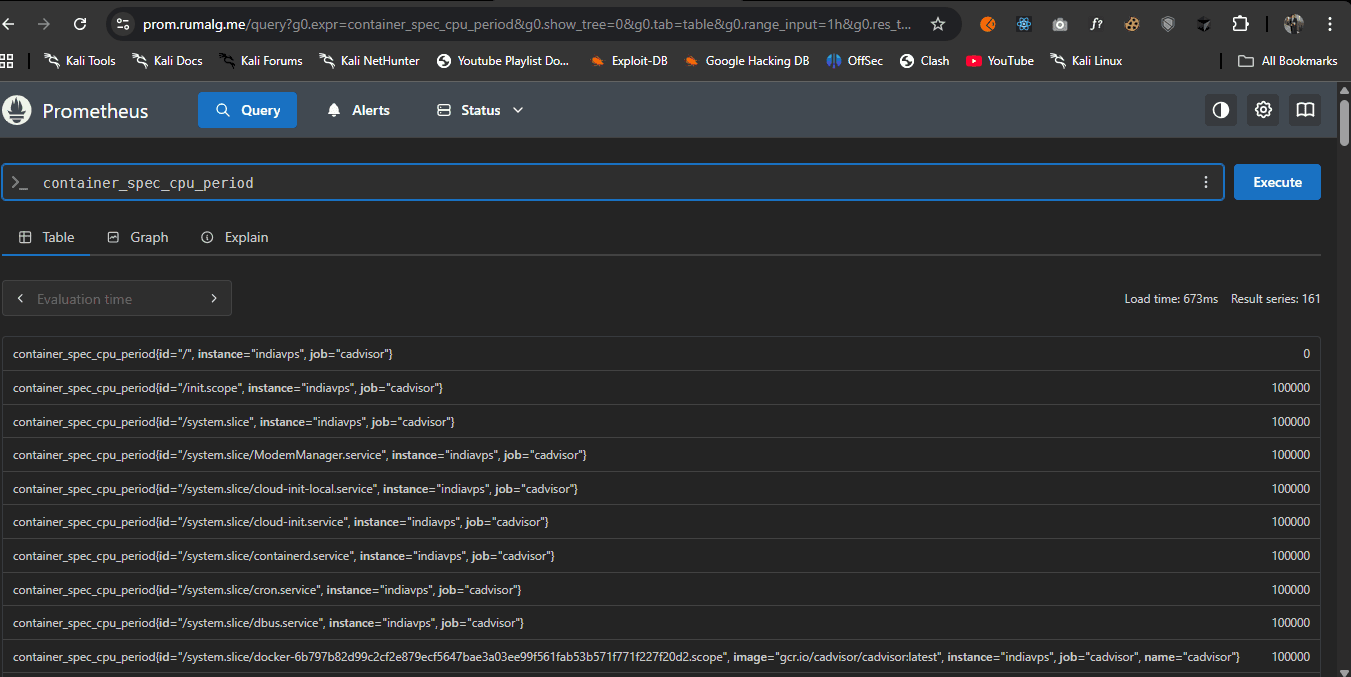
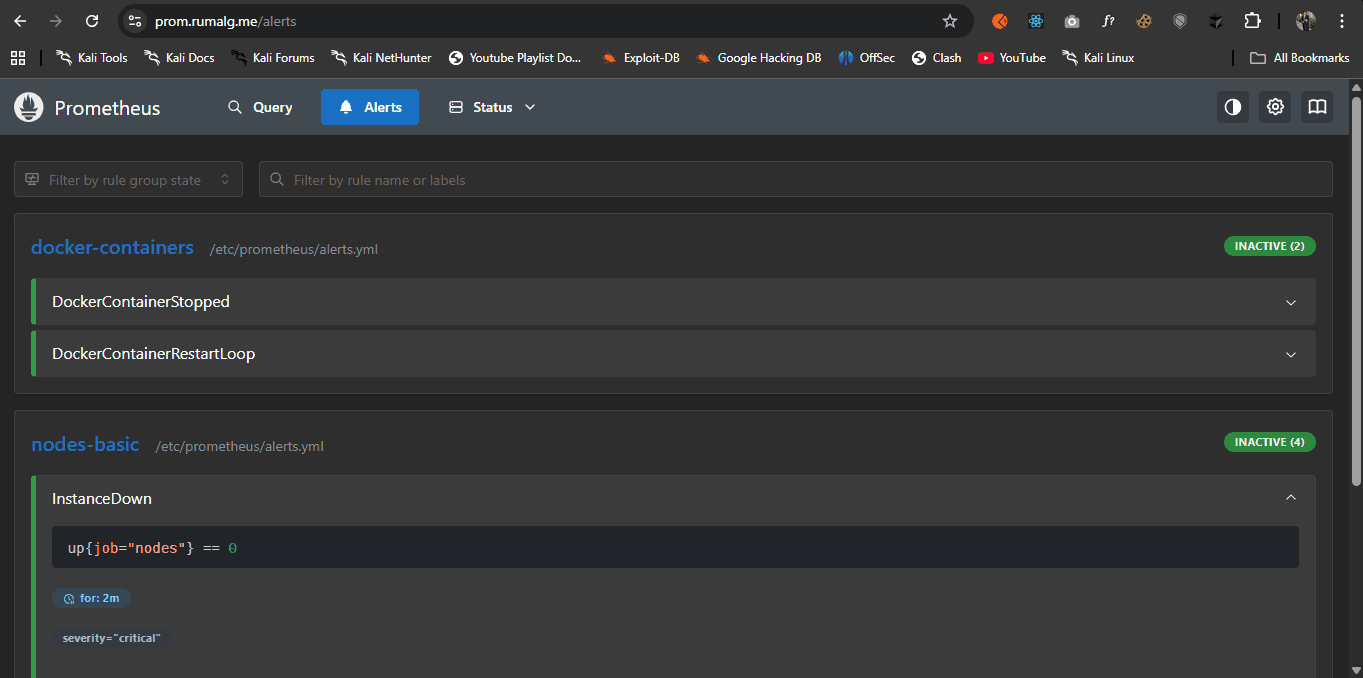
Operational visibility for deployed services, including runtime metrics, health checks, failure signals, and alertable service indicators.